
Summary
Business continuity and future growth rely on a rich supply of low cost and highly skilled workers.
The challenge for many businesses is they routinely locate their operations based on real estate availability, with labor as a secondary consideration. Sadly, they are looking through the wrong end of the telescope.
Have the rumors of the labor force demise been greatly exaggerated?
Many an employer is wrestling with their inability to find labor these days pre and post COVID-19. Labor is portable, within limits, so maybe they are not looking in the right places. But don’t expect your typical manufacturing worker to commute more than 30-40 minutes.
So, if these employers are committed to remain in their current locations, removed from a dense concentration of workers, expect their sleeplessness nights to continue.
For those manufacturers in growth mode, planning to expand production, there are a number of markets you should consider to ensure great access to skilled production labor.
If you don’t know where you’re going, any road will take you there.
Using Colliers Indsite®, we completed an analysis of U.S. labor markets to identify the best pools of manufacturing workers, focusing on five critical characteristics:
- Manufacturing workers as a percent of the total workforce
- Density of manufacturing workers
- Manufacturing worker commuting patterns
- Wage rates
- Labor union environment
Let us show you how we did it.
To start, we selected all locations in the U.S. in which at least 15% of employed residents work in manufacturing. This is about twice the national average.
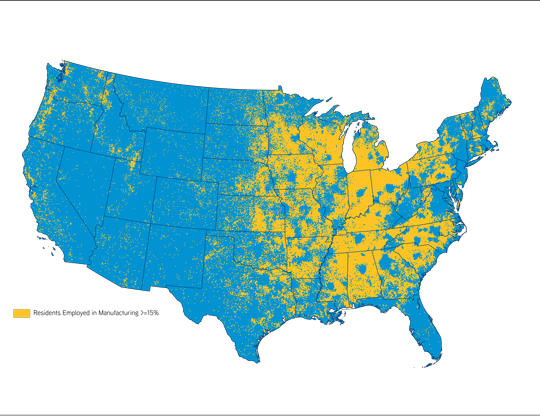
Then, we looked for areas in which at least 20 people per square mile are employed in manufacturing. This screen is far more stringent than manufacturing’s share of employment, as shown on the accompanying map. (A lot less yellow!)
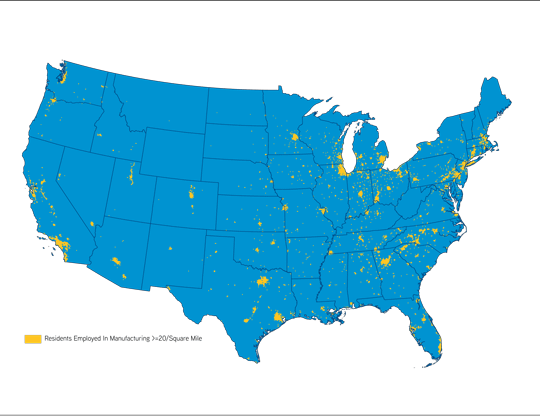
In combination, these two variables identify areas with both deep pools of manufacturing labor, and in which manufacturing is a significant share of the workforce. We are off to a great start, but there is more.
Can we keep workers close to home?
Added to the analysis was an assessment of commuting patterns for manufacturing workers. The analysis was configured to identify those areas which export a significant number of production workers, in this case, at least 5 workers per square mile. This figure represents net export, that is, number of in-commuting workers less the number of out-commuting workers. Out-commuting had to exceed in-commuting by at least 5 for a location to be included. Our rationale… most commuters would prefer to stay close to home and avoid the drive.
Cost is king… why pay more?
Next, wages were factored into the analysis by eliminating all areas in which the median wage for a machine operator exceeds $15.77. This wage includes the bottom 40% of wage earners in this job category. No one wants to pay more, if possible, so we went low.
Big labor or not?
Finally, we created a filter for labor union activity in manufacturing employers. To be considered, a location can have no more than 20 labor union certification elections per 10,000 manufacturing workers. This metric normalized election activity based on employment, so areas of the Rust Belt with high levels of election activity were not unduly penalized.
So, what’s the answer?
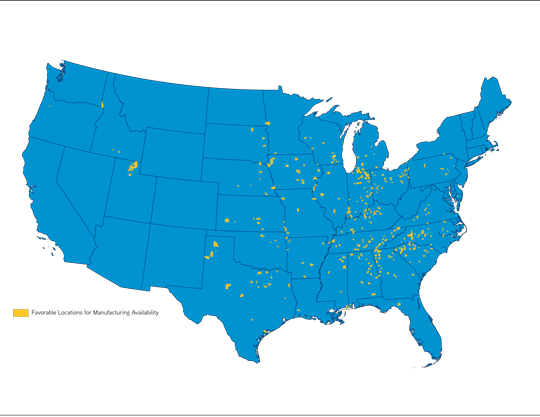
The accompanying map shows the locations that passed through all five screening filters we established. The areas in yellow meet all of these conditions:
- High share of manufacturing employment
- High number of manufacturing workers
- Manufacturing worker commuting patterns favorable to the employer
- Low manufacturing wages
- Low levels of union organizing in manufacturers
There are many metrics that offer a deep understanding of labor availability. We examined only five using Indsite®, but these are instrumental in revealing where manufacturers will maximize the likelihood of finding a deep pool of skilled workers at an attractive wage in markets with low levels of union activity.
Labor is certainly tight in many markets across the U.S., but if you know where to look, you can find them. How do you get started? We start with Indsite.